


What is Power BI?
First, let’s start at the beginning. What is Power BI? What is it used for?
Power BI is a Microsoft business intelligence application. That’s what BI stands for: Business Intelligence.
This application helps you combine data from different sources and systems, and then shape and present it in a way, so you understand what’s going on in the business.
So basically, with this single app, you get to do two crucial tasks.
- Identify dangers before they explode into massive headaches so basically you get to put out fires before they spread.
- On the upside, you get to discover opportunities that will grow the business and probably make you look like a hero.
It sounds like a magic tool.
Talking about magic, look at this, it’s the Gartner Magic Quadrant for Analytics and Business Intelligence platforms.

Gartner is an I.T. consulting firm that publishes market research reports which show the position of the vendors within their market, whether they’re leaders or followers.
Look at where Microsoft is right now.

So according to this, Microsoft understands where the market is going and they’re executing that vision ahead of everyone else.
Compared to 2018, this is where Microsoft was.

It was still a leader, but it was closer to the pack. That’s amazing considering that Power BI was first released in 2011, compared to Tableau which was released in 2005.
Now, Microsoft is running away from the pack. They’re becoming the trendsetter in the business intelligence field. They’re implementing what customers want.
They’re investing heavily because there’s demand, and if there’s demand this means that companies are implementing Power BI Solutions, which also means that they need people who know how to implement it.
Featured Course
Fast Track to Power BI

Can Power BI reports be created by anyone?
In my old company, we had a self-service business intelligence tool, which by the way is what Power BI is as well.
When I first heard the term ‘self-service’, I thought, “I can serve myself.”, Like Excel, I’ll open it up, move stuff around, do my analysis, do my calculations, and then close it.
But no, that wasn’t the type of self-service that was offered. It was more like this:
- First, I log a call, which meant opening a ticket.
- Then, have a bunch of back and forths, explaining what I wanted with screenshots and examples.
- Next, I had to wait for approval.
- Once that was done, it would be sent off to specialized external consultants for implementation.
- Then, it will finally be my turn to test in the test environment
Usually, at that point, there were one or more things that needed fixing, so we had more back and forths.
If we were lucky, it would, at some point, go live. If we were doubly lucky, what we wanted three months ago was still valid that day, which wasn’t always the case.
That was my experience with a self-service BI tool. These types of tools, as you can imagine, are also very expensive for businesses. They can’t afford to spend so much on just reporting.
That’s why Power BI is now the leader in their market. Because, in my opinion, it solves four main business problems.
Sharing Reports is Easy with Power BI
One is the problem of sharing reports. This wasn’t always easy. If your reports were in Excel, you had to keep sending these around. If they were on the web, you needed to use the browser or a special app to access them.
With Power BI, you have multiple options. You can view your reports on the browser.

You can view them from your mobile device.

You can embed Power BI reports live in a PowerPoint presentation.

You can embed these reports on a website.

You can add a Power BI report to your Teams channel.

You can also connect your Excel files to your Power BI data.

So you set up your datasets and reports in Power BI once, and then you can access them pretty much from everywhere.
There’s also security that you can set which defines what different people can see.
Now, on top of that, you can also set alerts so you get email notifications when a threshold is passed.
You can also schedule data to be automatically refreshed.
Power BI Implementations are Fast
The next problem businesses had with BI tools was the long implementation times and high costs that were associated with them.
Power BI is easy to implement. It’s easy to learn and it’s easy to use.
To get started, you can download the Power BI Desktop app from the Office store and use it for free. If you can use Excel, you can use Power BI.
You can create reports quickly and easily.

You don’t have to be in IT, and you don’t need a coding background.
Power BI Eliminates Decision Paralysis
The third problem Power BI solves is that it eliminates decision paralysis. You see, because many BI projects take forever, they’re more rigid. And you can end up spending days deciding whether you want to compare this value to that or something else. Which one is more important?
Well, with Power BI, you can make updates with a few clicks and create different reports and different views. You’re not restricted to a certain number of reports.
You also don’t need a designated person to create reports if you don’t want. You can have it behave like a real self-service tool where people can create their views and reports.
Power BI is More Than Beautiful Reports
The fourth problem Power BI solves is it goes beyond just creating beautiful reports.
A lot of people associate Power BI with fancy reports.

It can do that, but it can do a lot more. It’s like saying your smartphone is just for making phone calls.
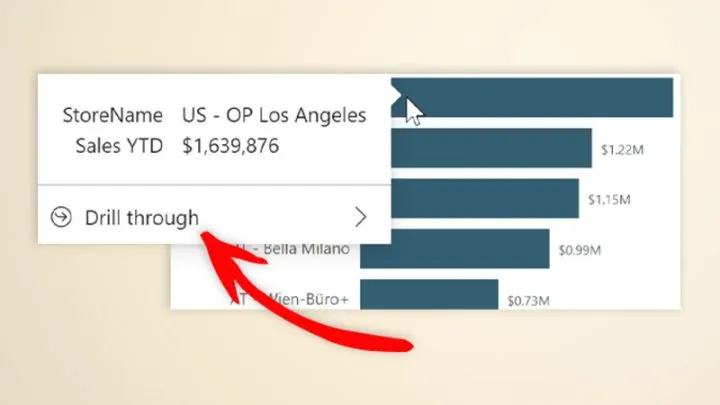
Some managers like fancy reports, right? They want interactivity; they want to slice and dice as they need. But other managers might love detail, they want to drill through and drill down, and they want tables.
With Power BI, you get to cater to all of them.
If someone wants to get their hands dirty and they want to use Excel and create an Excel dashboard, they can. They can connect to your Power BI model. That’s the beauty of keeping everything in a single place. You have one source of truth where all your data and calculations are and then, you can create different reports in different places, Power BI or Excel.
The Essence of Power BI
In summary, Power BI allows you to connect to different data sources.
You get to clean the data, relate the data, create additional calculations based on this clean data, and then, create and share your reports in super flexible ways.

Are You Ready for Power BI?
But because we at XelPlus believe that Power BI is the future, we want our community to be ahead of the curve.
So, the announcement that I mentioned at the beginning of this post is that we released our Fast Track to Power BI course.
If you want to make the switch to Power BI, our approach is designed for you to use Power BI at work on day one.
We set it up in this way so that you start on the fast track, so we can get you through the most important features and concepts. This way, you get the most out of Power BI in the smallest amount of time possible.

And then, we created the expert lane, where you get to hone your skills in each aspect of Power BI.
We also made it fun and project-based.
You start your journey as a data analyst at a flagship store of OfficePlus in California. Your go-to app at the start is Excel but you feel the shift to Power BI is coming, so you decide to give it a go and create your first Power BI report.
I don’t want to give away too many details, but you do end up getting promoted to a senior position at OfficePlus headquarters. And there, things are a lot more challenging though, in terms of data cleaning, data modeling, and the calculations that they need than they were in your previous job, so you need to level up your skills to cater to these challenges.
If you want to be ahead of the curve, like Microsoft, and have a massive advantage over the others in the field, join our course and we’re going to get you Power BI fluent in no time.
Power BI vs Excel Cheat Sheet
]How does it compare to Excel? In this Cheat Sheet, I’ve summarized some of the differences between Power BI and Excel.
Remember that one tool is not better than the other.
Power BI may have the edge when it comes to visualizations and sharing, but Excel still remains one of the most flexible analytical applications out there.
They both serve their purpose well, and you can take advantage of both thanks to built-in integration of Excel in Power BI. You can read more about it here: Import Power BI Data into Excel.

Leila Gharani
I'm a 6x Microsoft MVP with over 15 years of experience implementing and professionals on Management Information Systems of different sizes and nature.
My background is Masters in Economics, Economist, Consultant, Oracle HFM Accounting Systems Expert, SAP BW Project Manager. My passion is teaching, experimenting and sharing. I am also addicted to learning and enjoy taking online courses on a variety of topics.