Creating Drill Through Pages
With Drill Through in Power BI reports, you can create a destination target page in your report that focuses on a specific entity such as a supplier, customer, or manufacturer.
When your report readers right-click a data point in other source report pages, they drill through to the target page to get details that are filtered to that context. For example: selecting a specific store in a bar chart from the main dashboard can send the viewer to a details page that shows a variety of visualizations based on the selected store.
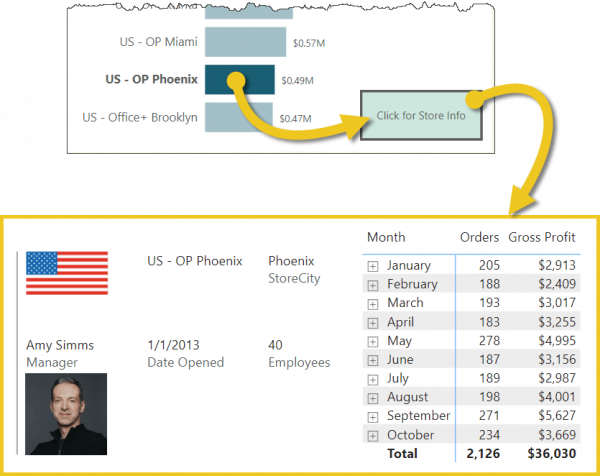
You can set up drill-through in your reports in Power BI Desktop or the Power BI Service.
Featured Course
Fast Track to Power BI

Step 1: Create a High-Level Dashboard Page
The first step is to create a report page that will serve as a launching pad for the Drill Through feature.
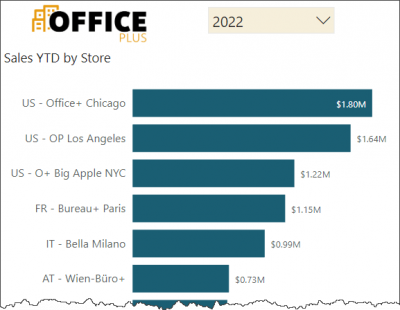
This page will contain high-level information. For example, we give the user the ability to select a year via a Slicer. This filters a Bar Chart visual.
Step 2: Setting Up a Drill Through Details Page
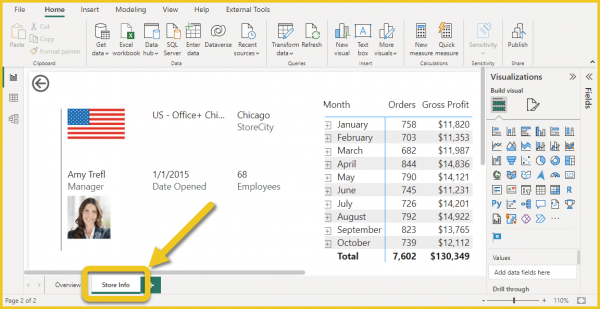
The next step in setting up a drill-through environment is creating the report page that the user will be switched to when clicking a visual from another report page. We’ll name this page “Store Info”.
This page can be like any other Power BI report page; the difference is that when the user is transported to this page, the visuals will be filtered according to the item selected on the previous page when invoking the Drill Through feature.
This example’s details page will contain the following information:
- Where is the store located?
- Who is the store’s manager?
- When did the store first open?
- How many employees does the store have?
- How many orders and what is the gross profit per month or day?
Step 3: Setting Up the Drill Through Logic
Once the page has been created with the needed visualizations, it’s time to set this page as a potential drill-through destination.
NOTE: The Drill Through is set up on the destination page, not the page where the user is invoking the drill through feature.
On the Drill Through destination page, select an empty part of the report page.
Using the Visualizations -> Build Visual -> Drill Through section of controls, add the fields that will influence the filtering of this page’s visuals. In this case, we want to filter by the selected [Year] and the selected [StoreName].
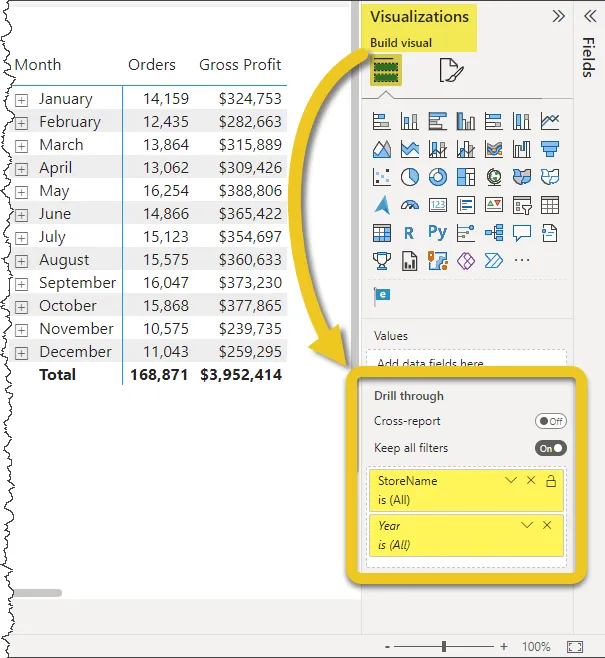
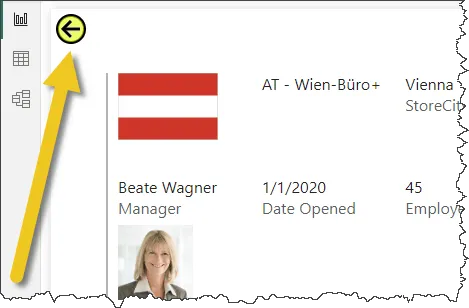
NOTE: Notice that when the fields are added to the Drill Through feature, Power Bi automatically adds a “Back” button to the upper-left corner of the report page. This will give the user the ability to easily return to the main dashboard.
Featured Course
Power Excel Bundle

Testing the Drill Through Functionality
To test the Drill Through feature, return to the man dashboard sheet.
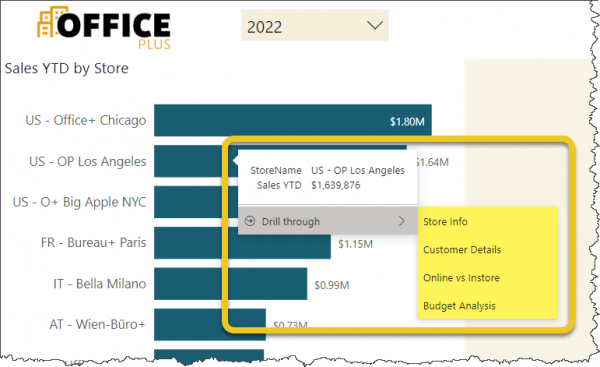
When hovering the mouse pointer over any of the bars in the Bar Chart, the normal Tooltip popup is enhanced with the option to navigate to the Store Info report page.
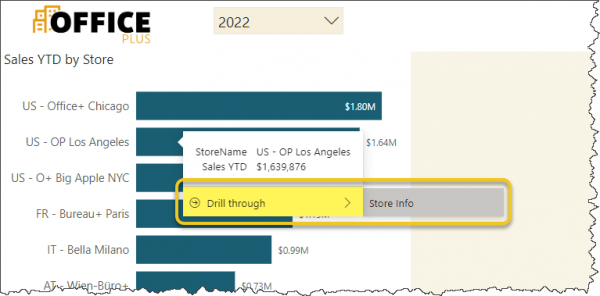
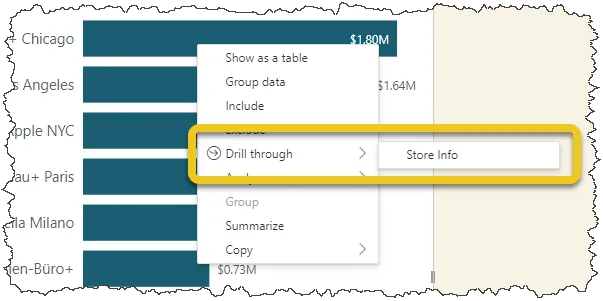
If the enhanced Tooltip for Drill Through does not appear, you can right-click on the bar to reveal the Drill Through feature.
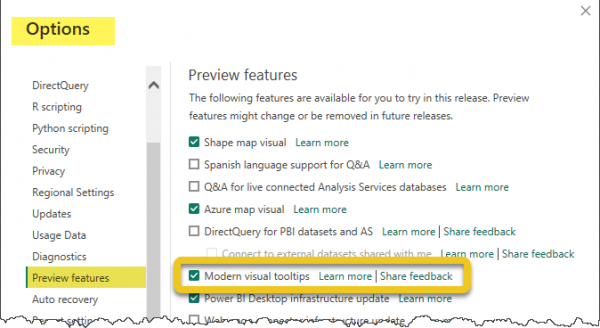
NOTE: The enhanced Tooltips that display the Drill Through when hovering is a Power BI Preview feature. This can be activated by selecting File -> Options & Settings -> Options -> Global -> Preview Features -> Modern Visual Tooltips.
Selecting “Store Info” will navigate the user to the “Store Info” report page and apply filters to the page’s visuals. If the user started this Drill Through process from the “US – OP Los Angeles” bar in the Bar Chart, the visuals on the report page will be filtered for “US – OP Los Angeles”. (Visuals are also filtered for the year “2022”. This filter came from a Slicer on the same dashboard page.)
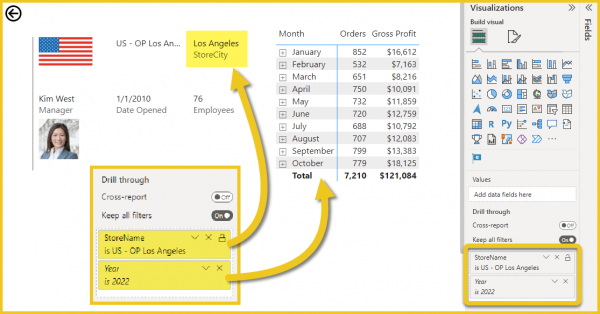
To return to the Dashboard page, hold down CTRL and click the “Return” arrow in the upper-left corner of the report page. (Pressing CTRL is only required when working in Power BI Desktop. Once the report is published, the user will only need to click the button; the CTRL key will not be required.)
Utilizing Multiple Drill Through Report pages
You are not limited to a single Drill Through destination. This process can be repeated as many times as necessary, providing the user with various directions to take the report based on their interests.
Making Drill Through More Intuitive
Let’s be honest, it’s not exactly common sense to hover over a bar or right-click a bar to understand that additional, more detailed information can be displayed.
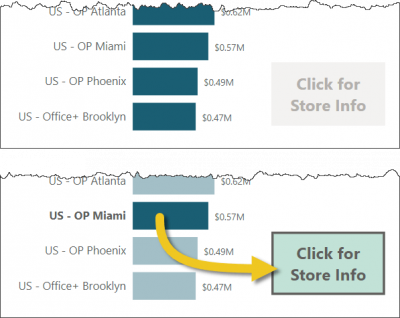
A creative way to inform the user of this feature is to add a button that is highlighted when a bar is selected, inviting the user to explore the data at a deeper level.
To create this feature, perform the following steps:
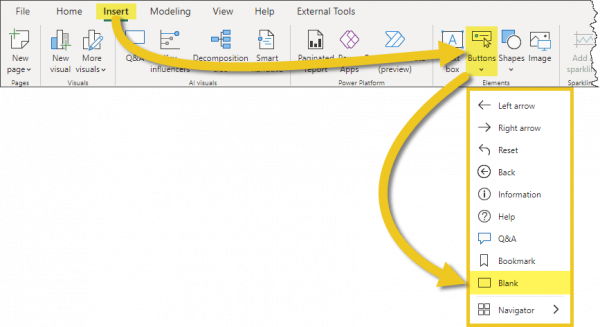
- Insert a blank button by selecting Insert (tab) -> Elements (group) -> Buttons -> Blank Button.
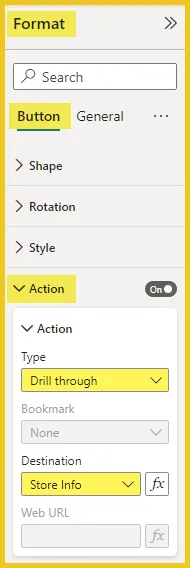
- Assign the button an action that is to be performed when clicked by selecting Format -> Button -> Action -> On. Set the Type to Drill Through and set the Destination to the desired detail report page created earlier.
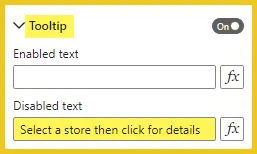
- Below the Action controls, expand the Tooltip controls and enter a message that will appear when the user hovers over the button, like “Select a store then click for details”.
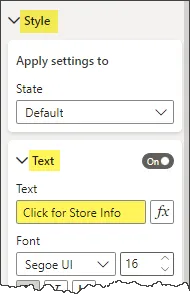
- Next, we add text to the button. Expand the Style controls then expand the Text Enter the text to be displayed on the button, like “Click for Store Info”.
With the button created and configured, the behavior of “disabled when no selection is made but enabled when a single selection is made” is automatically in place. There is no need to create any complicated background code to have this feature operate properly.
BONUS: Clickable Links for Tables & Matrix Visuals
Creating Link Icons
Suppose you have a Data Model that contains a field that stores URL (i.e., website) links. By default, they are stored as text, but if you want them active (i.e., clickable), in Data view under the Column Tools ribbon, assign a Data category “Web URL”.
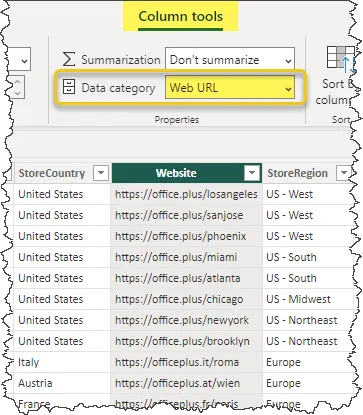
When used in a report, such as with a Matrix or Table visualization, the results appear as follows.
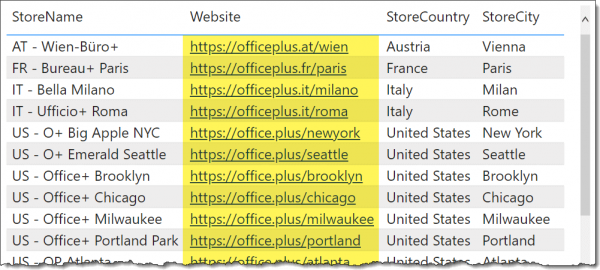
Imagine a table of products with links to web pages containing product details. Many of these links will likely be quite long and impractical when displayed in a report.
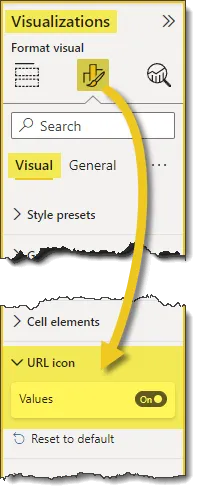
The website links can be made more presentable (and space-saving) by performing the following:
- Select the Matrix or Table visualization containing the web links.
- From the Visualizations panel, select Format -> Visual -> URL Icon -> Values.
- Toggle this to an On
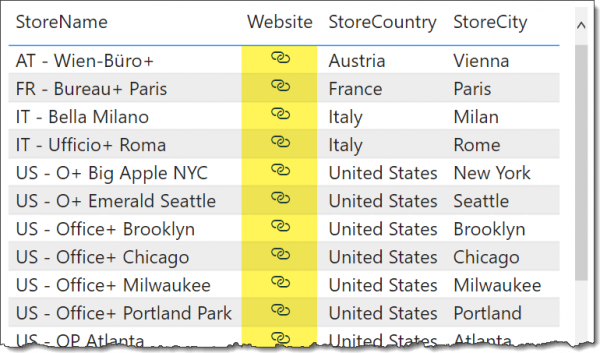
This will display the URL information as link icons.
Embedding URL Links into Other Fields
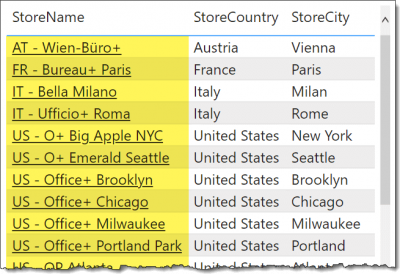
It’s possible to take the previous example to another level by embedding the URL information into a different column, like the “StoreName” column.
This would make the report more efficient by removing the column of link icons whilst retaining full functionality.
To apply this feature, perform the following steps:
- Select the Table or Matrix visualization in which you wish to embed URL information.
- From the Visualizations panel, select Format -> Visual -> Cell Elements
- Select the Series (field/column) that you wish to hyperlink.
- Toggle Web URL to an On

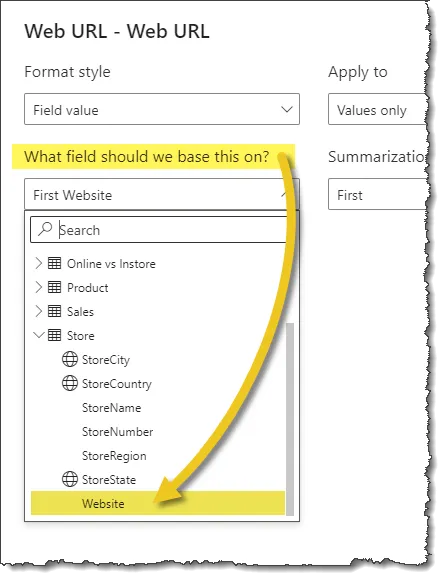
A Web URL dialog box will appear that requires the table and field that contains the URL information.
- From the “What field should we base this on?” dropdown list, browse the table and select the field containing the needed URL information.
- Click OK to complete the process.
With the original URL field removed from the visualization, the updated version appears as follows:
Featured Course
Master Excel Power Pivot & DAX (Beginner to Pro)

Leila Gharani
I'm a 6x Microsoft MVP with over 15 years of experience implementing and professionals on Management Information Systems of different sizes and nature.
My background is Masters in Economics, Economist, Consultant, Oracle HFM Accounting Systems Expert, SAP BW Project Manager. My passion is teaching, experimenting and sharing. I am also addicted to learning and enjoy taking online courses on a variety of topics.


