Working with the Power BI service online, we have a dashboard with the following interactive features:
- Slicers that allow us to filter by years
- Buttons that switch us between pages
- Slicers that allow us to select departments and channels
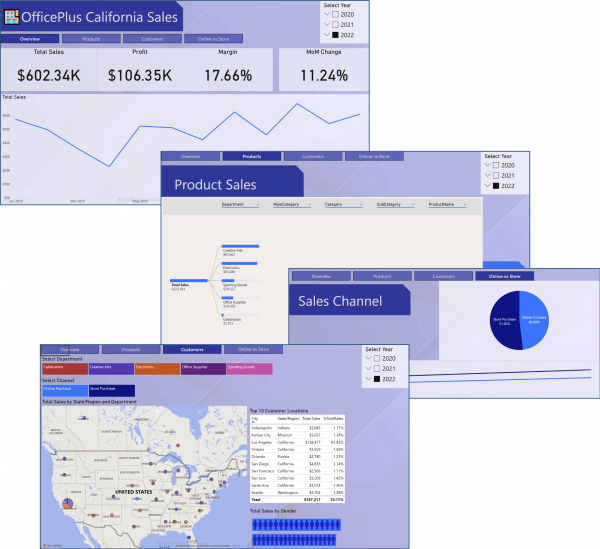
We want to export this dashboard to PowerPoint and retain interactivity.
Power BI now has an option behind the Export button called Embed Live Data.
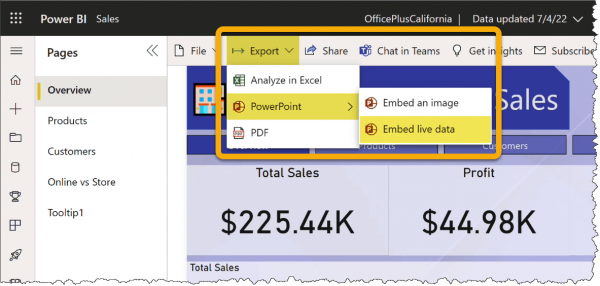
When selected, we have the option to open the dashboard in PowerPoint with or without the current filter selections.
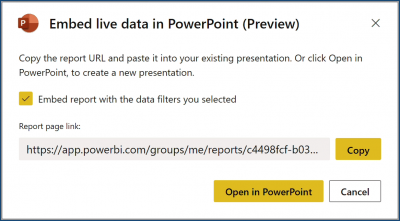
NOTE: As of this post’s publish date (July 2022), this feature was still in preview release. It has since become generally available with the March 2023 release.
Selecting the Open in PowerPoint option presents the following message.

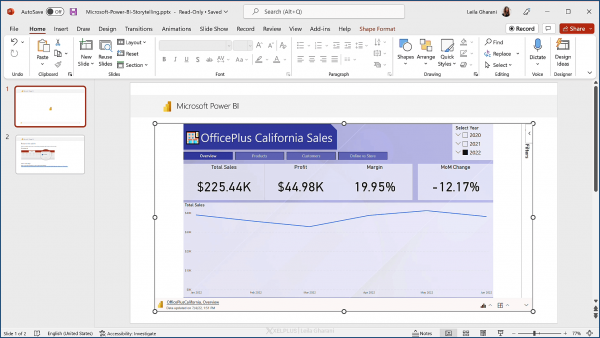
Clicking the “Trust this add-in” will load the Power BI report into a PowerPoint slide.
Featured Course
Fast Track to Power BI

Obtaining the Power BI Add-In for PowerPoint
We need to take a step back and talk about obtaining the Power BI add-in for PowerPoint.
Before we can just drop a Power BI report into PowerPoint as easily as has been demonstrated, you need to first visit the Microsoft Store and download and install the Power BI add-in for PowerPoint.
- Launch the Microsoft Office Add-Ins feature by selecting Insert (tab) -> Add-ins -> Get Add-ins.
- Search the Office Add-Ins for “Power BI”.

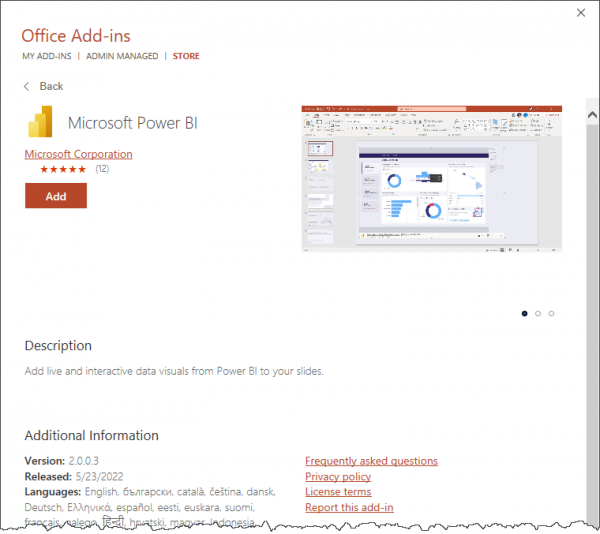
Once added to PowerPoint, you will see the add-in on the Insert ribbon.

Featured Course
Power Excel Bundle

Testing Report Interactivity
By having the Power BI add-in as part of PowerPoint, we have full interactivity in our PowerPoint slide, both in Presentation Mode and standard Slide Design Mode.
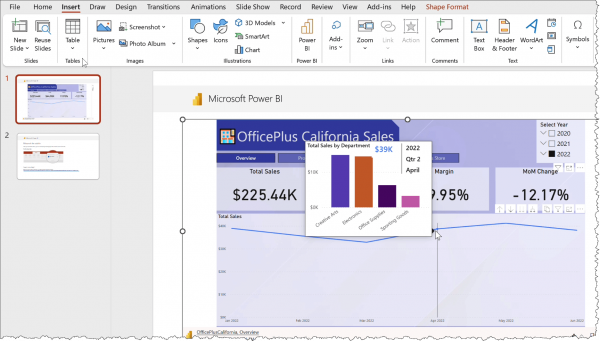
Notice that the only page we have from our report was the page displayed when we performed the Embed Live Data action.
If you need other pages from the report, those pages will need to be inserted separately.
One workaround to this is to include a page navigation interface on the needed pages.
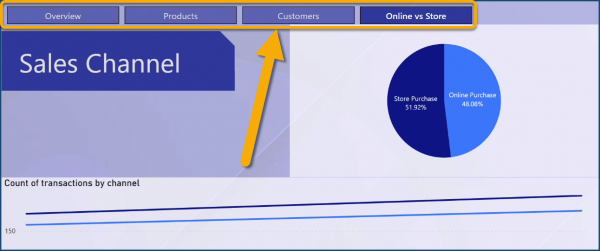
Buttons and bookmarks are fully operational.

Featured Course
Excel Essentials for the Real World

Adding a Power BI Report to an Existing Presentation
When working with an existing presentation, we can easily add a Power BI report by creating a new, blank slide and selecting Insert (tab) -> Power BI.

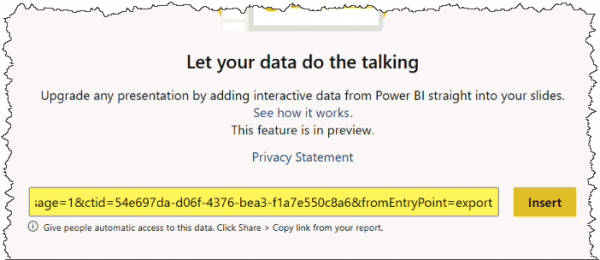
Our slide presents a placeholder that requests the link we saw earlier from the Power Bi service when we perform the initial export routine.

Click the Copy button to place the Power BI report link on the Clipboard.
Return to PowerPoint and paste the link in the placeholder and click Insert.
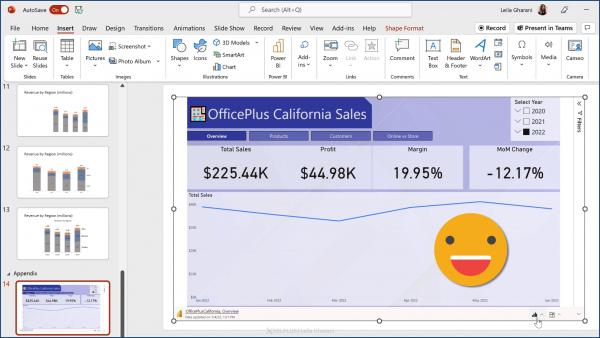
Deeper Analysis During a Presentation
In addition to the report’s slicers and buttons working during the presentation, we can also leverage Power BI’s filter controls.
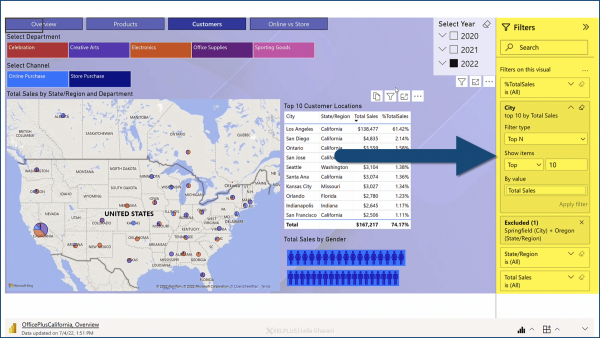
This embedded report is arguably superior to embedding Excel dashboards as Excel’s interactivity does not carry over to PowerPoint.
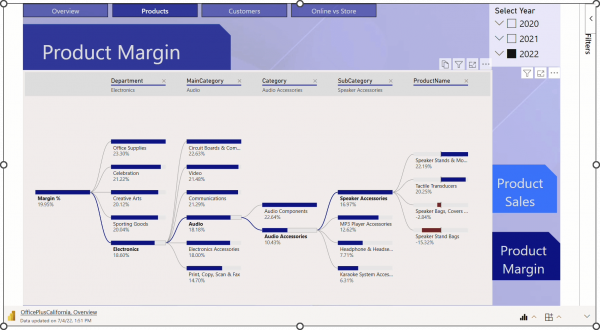
Additional Presentation Features
Capturing a Screenshot
If you need to capture a screenshot of the report during the presentation, click the arrow button in the upper-right corner and select Show as Saved image.
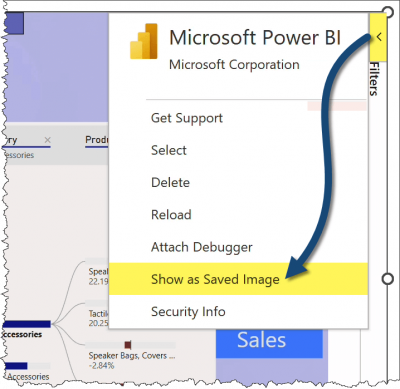
You can then right-click the report and copy it to the Clipboard for pasting it onto another slide or any other application.
To return to the interactive version of the report, click the arrow button in the upper-right corner and deselect Show as Saved image.
Report Options
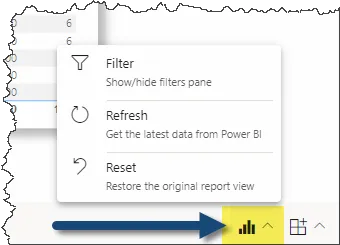
In the lower-right corner reside controls for hiding the filter pane, refreshing the data, and resetting the report.
Changing the Report’s Story
Any changes made to the Power Bi report in the PowerPoint slide do not flow back to Power BI.
However, changes to the Power BI report at the source will flow down to PowerPoint when the slide link is refreshed.

Deleting a Report from a Slide
Clicking a Power BI report on a slide and pressing the Delete key will not remove the report from the slide.
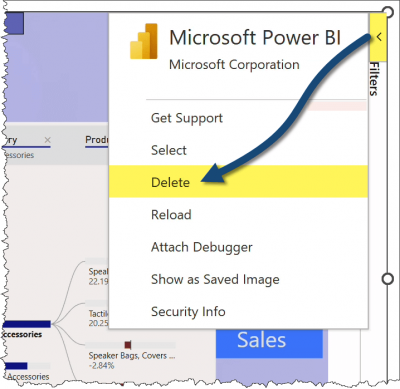
To remove the report from the slide, click the arrow button in the upper-right corner and select Delete.
Hiding the Status Bar
If you don’t wish to display the bottom banner with the report add-in controls, click the down-arrow button in the lower-right of the report.

Viewing Report Status
The lower-left corner of the report displays the name of the Power BI report file as well as the date and time of the last refresh.

Clicking the report’s name will take you to the full report on the Power BI website.
Sharing the Report
If you share the report with an associate, the person with which you are sharing must have a Power BI account and have been granted access to the report and its underlying dataset.
The report and its data are not stored in the PowerPoint file, only a connection is created between PowerPoint and Power BI. The interactivity is displayed in real-time as the presentation is being used.
All security permissions are retained and respected.
Leila Gharani
I'm a 6x Microsoft MVP with over 15 years of experience implementing and professionals on Management Information Systems of different sizes and nature.
My background is Masters in Economics, Economist, Consultant, Oracle HFM Accounting Systems Expert, SAP BW Project Manager. My passion is teaching, experimenting and sharing. I am also addicted to learning and enjoy taking online courses on a variety of topics.


