Examining the Data and the Issue
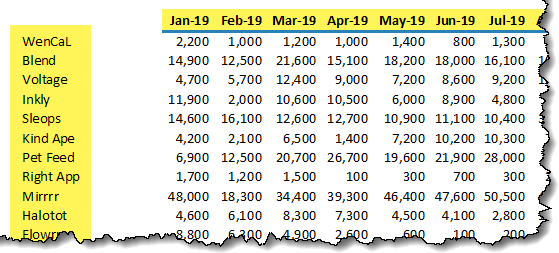
Our data consists of a list of apps and their monthly profit across two years of months.

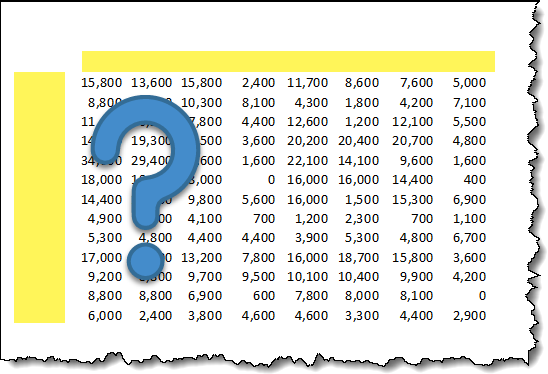
If we run a Print Preview on the data, we see that the information is split across 4 pages.

The problem is that when viewing any page other than page 1, we are missing row and/or column heading information. This is especially frustrating on page 4 where we have no heading information whatsoever.

We have no idea what app or month any of the profit numbers represent.

Solving the Problem of Missing Headers
To repeat the row and/or column headings, begin by select Page Layout (tab) -> Print Setup (group) -> Print Titles.

In the Page Setup dialog box, select the Sheet tab. The controls we are interested in are in the section labeled Print Titles.

For our report, we want the list of months to be printed at the top of each page and the app names to be printed on the left of each page.
First, the month headings. In the Page Setup dialog box, click inside the field labeled “Rows to repeat at top”.
Next, click anywhere on the row containing the month headings (row 5). This will place a $5:$5 reference in the option field.

Next, the app headings. In the Page Setup dialog box, click inside the field labeled “Columns to repeat at left”.
Next, click anywhere in the column containing the app headings (column A). This will place a $A:$A reference in the option field.

Click the Print Preview button in the bottom right of the Page Setup dialog box to refresh the preview.
From any page, we remain aware of the precise app and month/year from which the profit is assigned.

One Minor Issue
If we look closely at page 3 we see the unrelated text of column A in the upper-left corner of the printout.

To keep this unrelated information from appearing, we can set out print area to only include the data we need on the printout.
Highlight the area containing the data (cells A4 through Y45) and select Page Layout (tab) -> Print Setup (group) -> Print Area -> Set Print Area.

Returning to Print Preview we can see that the unneeded text of column A has been omitted from the print result.

Keep Track of Page Order with Page Numbers
As with all multi-page printouts, especially those that traverse vertically as well as horizontally, it’s a good idea to include page numbers in either the header or footer of the pages.
The Page Layout view is one way to setup your headers and footers with page-independent information.
Two popular ways to activate the Page Layout view:
- Click the Page Layout view button (middle button) in the lower-right corner of the application window (left of the Zoom slider)

- View (tab) -> Workbook Views (group) -> Page Layout

In the Page Layout view, you can see how your report will appear when cut into individual paper-sized segments.

You also get access to the top margin that contains the header as well as the bottom margin that contains the footer.

The header and footer are broken into three segments.

Activate one of the segments by clicking inside the segment boundaries. This will activate the Header & Footer ribbon.

You can type static text directly in the segments. This is useful for things like report names, contact information, or any text that should always appear.

You can also use any of the document info “stamps” included in the Header & Footer Elements group.

Items of interest include:
- Current page number
- Total number of pages
- Print date
- Print time
- The file’s folder location
- The file’s name
- The sheet’s name
- Images (such as corporate logos)
Any of these elements can be inserted into any of the 3 header or 3 footer segments.
If we want to display the current page number along with the total number of pages, we must build this with a combination of elements and static text.
- Select a segment (ex: center of footer)
- Type the static text “Page “ (include a space after the word “page”)
- Click the Page Numbers element
- Type the static text “ of “ (include a space before and after the word “of”)
- Click the Number of Pages element


QUICK TIP: You can also insert pre-configured headers and footers by selecting the Header or Footer buttons (left side of Header & Footer button).

If you see a selection with multiple entries separated by commas, the commas indicate segment divisions.


Conclusion
As we can see, with a few clicks and a few seconds, we can transform a difficult to read report into something much more useful.
Leila Gharani
I'm a 6x Microsoft MVP with over 15 years of experience implementing and professionals on Management Information Systems of different sizes and nature.
My background is Masters in Economics, Economist, Consultant, Oracle HFM Accounting Systems Expert, SAP BW Project Manager. My passion is teaching, experimenting and sharing. I am also addicted to learning and enjoy taking online courses on a variety of topics.


