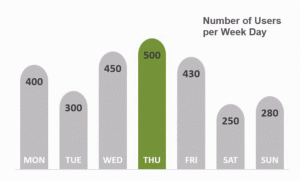
There were two obstacles:
One was to get the exact same shape proportions for each category (i.e. no stretched out bars) and second to get the conditionally formatted part (the one with the green bar) to update automatically if another week day happens to have the most users.
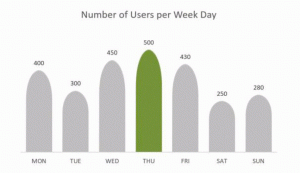
You might be familiar with using shapes in charts. The problem though is, they get stretched out. Like this example below:

Notice that the week days with the most users, Thursday for example, has a stretched out tip as compared to Saturday. This is standard behavior if you try to use shapes or images for the bars.
To use shapes in the first place, all you have to do is copy your shape (Ctrl + C), then click on the series and paste (Ctrl + V). If you’d like to use the same shape I have in the image, you can insert it first from the insert/shapes options in Excel.
Here is the trick: To avoid the stretched out shape, you need two sets of shapes. One that doesn’t matter if it gets stretched out and the other is the one you want to avoid from getting stretched.

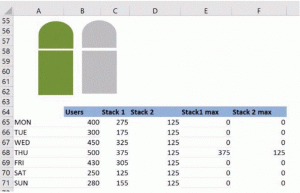
You basically need to create a stacked column chart using two sets of shapes. The part that can get stretched here is the rectangle. That’s Stack 1 in the image on the left. Stack 2, is the tip which we don’t want to get stretched.
The formula in my example for Stack 2 is =MIN(users)/2. This ensures that the tip for all the bars will remain the same. To get the bar conditionally formatted, i.e., to highlight the maximum, you need to introduce two sets of series using the max formula. The green series needs to be plotted on the secondary axis, otherwise they will end up as stacks on top of the original series (the grey ones).
This basically means that the chart that looks like a simple column chart, is in fact two sets of stacked charts. Yes, it does require some work, but once you have it setup, you can re-use as much as you want.
I find such charts a really nice addition to Dashboards and special reports!
Feel free to Download the Workbook HERE.

Leila Gharani
I'm a 6x Microsoft MVP with over 15 years of experience implementing and professionals on Management Information Systems of different sizes and nature.
My background is Masters in Economics, Economist, Consultant, Oracle HFM Accounting Systems Expert, SAP BW Project Manager. My passion is teaching, experimenting and sharing. I am also addicted to learning and enjoy taking online courses on a variety of topics.


