Let’s Begin With a Definition
Imagine you just received your test results for an Excel exam and learn that you answered 80% of the questions correctly. Also, your score ranks in the 70th percentile.
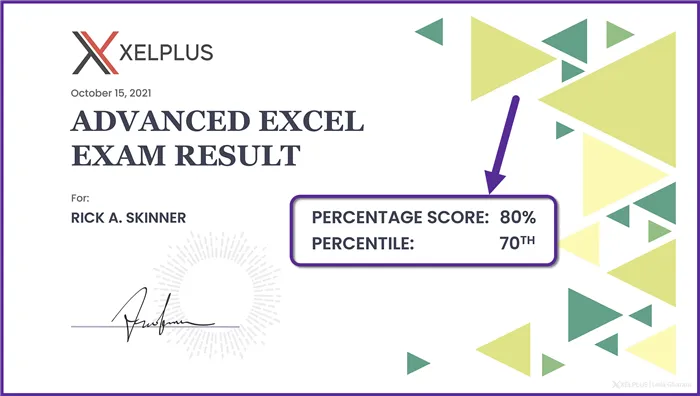
What does this mean? Is this good or bad?
Having a score in the 70th percentile means that 70% of all test scores were below your test score, and 30% of all test scores were above your test score.
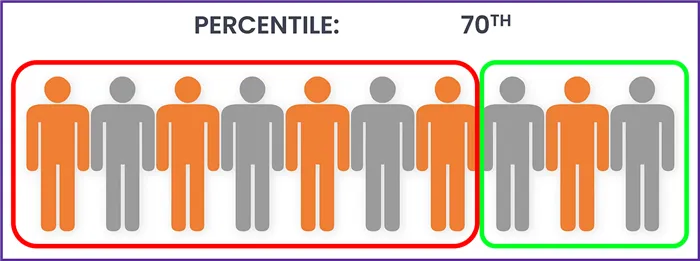
Said another way, 70% of the test takers answered fewer than 80% of the questions correctly, while 30% of the test takers answered greater than 80% of the questions correctly.
When describing percentile, we often use the word percentage. This is where the confusion comes in because the word “percentage” can mean different things depending on the sentence context.
The Difference Between Percentage and Percentile
Percentage
- Percentage is the mathematical value presented out of a total of 100.
- This is used as a means of comparing but based on a single case (e., one number).
- Percentages are denoted using the percent symbol (%).
Percentile
- Percentile is used to display a position or rank by comparing one case with several cases.
- This represents a percentage of values found under the specific values.
- Percentiles are denoted using a superscripted suffix, such as 1st, 2nd, 3rd, 4th, … 99th.
Consider this example:
- 10 people take a test
- 1 of those test-takers answered 80% of the questions correctly
- The other 9 test-takers answered more than 90% of the questions correctly
The one test taker may have scored an 80% on the test but ranked in the bottom 10th percentile among the other test-takers.
Featured Course
Excel Essentials for the Real World

Excel’s Percentile Functions
Excel has two methods for determining percentiles:
- PERCENTILE
- PERCENTRANK
Both functions are subdivided into two variations:
- Inclusive
- Exclusive

There are also two legacy versions of these functions, used for compatibility with Excel 2007 and earlier.

Inclusive vs. Exclusive
Without getting into the mathematical weeds of Linear Interpolation, the generic answer to this difference is:
- Inclusive evaluate all values in the data from the smallest value to the largest value.
- Exclusive evaluates all values in the data between the smallest value and the largest value. The smallest value is calculated as 1/n and the largest value is calculated as 1-1/n where n is the number of listed items.
If you had an unbroken list of integers from 0 to 100, inclusive would use every number in the list for the calculation.
Using that same unbroken list of integers from 0 to 100, exclusive would calculate the smallest value as .01 and the largest value as .99 with all remaining numbers falling between .01 and .99.
Creating Percentile Formulas in Excel
Let’s look at some sample data and see how we can use the various percentile functions.
We begin with a set of data that shows the average salary for a software developer in various countries.
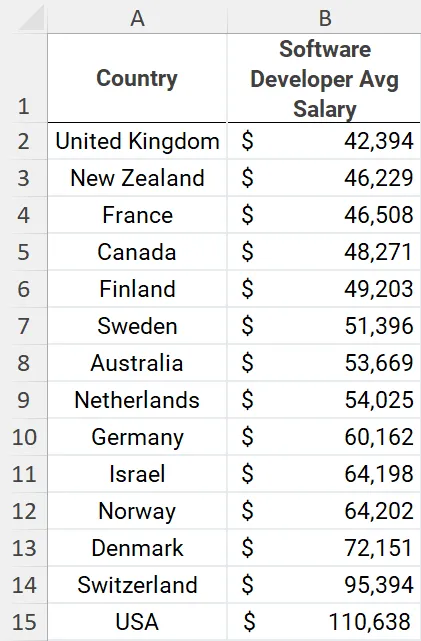
Our goal is to determine the 25th percentile across the range of salaries.
To do this inclusively, we can use Excel’s PERCENTILE.INC function.
PERCENTILE.INC has the following syntax:
=PERCENTILE.INC( array, k )Array is the list of values to be calculated.
K is the rank you need to determine.
For our example, determining the 25th percentile would require the following formula.
=PERCENTILE(B2:B15, 0.25)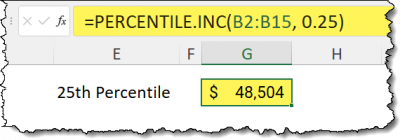
This means that 25% of the listed salaries are below $48,504 and 75% of the listed salaries are above $48,504.
If we wanted to calculate the 50th and 75th percentile values of these numbers, we can write the following formulas.
=PERCENTILE(B2:B15, 0.5)
=PERCENTILE(B2:B15, 0.75)
Featured Course
Master Excel Power Query – Beginner to Pro

Determining the Percent Rank
The opposite approach to these calculations is to take a value (like a salary) and determine where it ranks as a percentage within a range of other values.
This can be accomplished using the PERCENTRANK functions.
We’ll start with the inclusive version of PERCENTRANK.
PERCENTRANK.INC has the following syntax:
=PERCENTRANK.INC( array, x )Array is the list of values to be calculated.
X is the value you need to determine the rank for.
For our example, determine the percentile rank for a salary of $65,000.
=PERCENTRANK.INC( B2:B15, 65000 )
Getting Fancy Responses
If you want to get fancy, you could write the following formulas to take the PERCENTRANK.INC results and concatenate them to text with a bit of custom number formatting.
(NOTE: the result for PERCENTRANK.INC is in cell E11.)
=TEXT(E11,"0%") & " of salaries are BELOW your salary"
=TEXT(1-E11,"0%") & " of salaries are ABOVE your salary"
Keep in mind, the above formulas could use cell references for the values (k) or the percentages (x) instead of hard-coded values.
Using the Exclusive Versions of These Functions
The exclusive versions of these functions (PERCENTILE.EXC and PERCETRANK.EXC) do not include the extreme low and high ends of the data range. (For a more precise explanation of this linear interpolation process, click here to read the Wikipedia article on Percentile.)
If we wished to determine the 25th exclusive percentile of the same salaries, we could write the following formula.
=PERCENTILE.EXC( B2:B15, 0.25)
Notice that the 50th percentile yields the same result. However, the 15th and 75th percentiles are a bit lower and higher respectively.
This is compensating for the absence of the low and high ends of the data.
It’s as if the remaining data were “stretched” to reach the original low and high points.
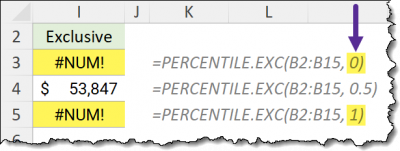
If we were to use the exclusive version of PERCENTILE and calculate for 0 and 1, we would see the following errors.
“Which one should I use?”
The use of the inclusive versus exclusive versions of PERCENTILE and PERCENTRANK comes down to your profession, the size of the data set, and the type of analysis you are performing; the story you are trying to craft.
The more commonly used version is the inclusive version.
Practice Workbook
Feel free to Download the Workbook HERE.

Leila Gharani
I'm a 6x Microsoft MVP with over 15 years of experience implementing and professionals on Management Information Systems of different sizes and nature.
My background is Masters in Economics, Economist, Consultant, Oracle HFM Accounting Systems Expert, SAP BW Project Manager. My passion is teaching, experimenting and sharing. I am also addicted to learning and enjoy taking online courses on a variety of topics.


